Polytope polygon coverages
First, we retrieve data within a polygon with polytope. Next, we convert the resulting CoverageJSON to Xarray.
[1]:
import earthkit.data as ekd

# lat, lon
coords = [
    [41.870881288, -8.8791360],
    [41.694339317422646, -8.824238614026456],
    [40.171924585721314, -8.902386975546364],
    [38.75694209400925, -9.493088042617785],
    [38.42424252381525, -9.171674240710018],
    [38.49907333213173, -8.676525850529856],
    [37.057269459205145, -8.971873318897366],
    [37.162874354643776, -7.406745406502978],
    [38.19776118392036, -6.931663452624974],
    [38.4280922170291, -7.321584397020473],
    [39.011852875635526, -6.9787177479519755],
    [39.66227871551288, -7.5393956904523804],
    [39.66568774825791, -7.03915852435145],
    [40.0019453234905, -6.883203763416162],
    [40.20373392742229, -7.035724907677206],
    [40.350463990828985, -6.8135246275213035],
    [41.030499770212515, -6.905947651233703],
    [41.593647729084154, -6.22847017956974],
    [41.67712153119277, -6.544984134823352],
    [41.949682257268876, -6.567927092516641],
    [41.96960294343674, -7.1747800681640115],
    [41.88337981339092, -7.196871678410446],
    [41.81334515396762, -8.156666519264604],
    [42.14242723772878, -8.205142297350534],
    [41.870881288, -8.8791360],
]


request = {
    "class": "od",
    "stream" : "enfo",
    "type" : "pf",
    "date" : -1,
    "time" : "1200",
    "levtype" : "sfc",
    "expver" : 1,
    "domain" : "g",
    "param" : "167/169",
    "number" : "1",
    "step": "0",
    "feature": {
        "type": "polygon",
        "shape": coords
    },
}

ds = ekd.from_source("polytope", "ecmwf-mars", request, stream=False, address='polytope.ecmwf.int')
da = ds.to_xarray()
da
2024-12-18 09:10:21 - INFO - Key read from /Users/cgr/.polytopeapirc
2024-12-18 09:10:21 - INFO - Sending request...
{'request': 'class: od\n'
            'date: -1\n'
            'domain: g\n'
            'expver: 1\n'
            'feature:\n'
            '  shape:\n'
            '  - - 41.870881288\n'
            '    - -8.879136\n'
            '  - - 41.694339317422646\n'
            '    - -8.824238614026456\n'
            '  - - 40.171924585721314\n'
            '    - -8.902386975546364\n'
            '  - - 38.75694209400925\n'
            '    - -9.493088042617785\n'
            '  - - 38.42424252381525\n'
            '    - -9.171674240710018\n'
            '  - - 38.49907333213173\n'
            '    - -8.676525850529856\n'
            '  - - 37.057269459205145\n'
            '    - -8.971873318897366\n'
            '  - - 37.162874354643776\n'
            '    - -7.406745406502978\n'
            '  - - 38.19776118392036\n'
            '    - -6.931663452624974\n'
            '  - - 38.4280922170291\n'
            '    - -7.321584397020473\n'
            '  - - 39.011852875635526\n'
            '    - -6.9787177479519755\n'
            '  - - 39.66227871551288\n'
            '    - -7.5393956904523804\n'
            '  - - 39.66568774825791\n'
            '    - -7.03915852435145\n'
            '  - - 40.0019453234905\n'
            '    - -6.883203763416162\n'
            '  - - 40.20373392742229\n'
            '    - -7.035724907677206\n'
            '  - - 40.350463990828985\n'
            '    - -6.8135246275213035\n'
            '  - - 41.030499770212515\n'
            '    - -6.905947651233703\n'
            '  - - 41.593647729084154\n'
            '    - -6.22847017956974\n'
            '  - - 41.67712153119277\n'
            '    - -6.544984134823352\n'
            '  - - 41.949682257268876\n'
            '    - -6.567927092516641\n'
            '  - - 41.96960294343674\n'
            '    - -7.1747800681640115\n'
            '  - - 41.88337981339092\n'
            '    - -7.196871678410446\n'
            '  - - 41.81334515396762\n'
            '    - -8.156666519264604\n'
            '  - - 42.14242723772878\n'
            '    - -8.205142297350534\n'
            '  - - 41.870881288\n'
            '    - -8.879136\n'
            '  type: polygon\n'
            'levtype: sfc\n'
            "number: '1'\n"
            'param: 167/169\n'
            "step: '0'\n"
            'stream: enfo\n'
            "time: '1200'\n"
            'type: pf\n',
 'verb': 'retrieve'}
2024-12-18 09:10:21 - INFO - Polytope user key found in session cache for user cgr
2024-12-18 09:10:21 - INFO - Request accepted. Please poll ./49adba5d-a694-4045-89da-19b07902acd8 for status
2024-12-18 09:10:21 - INFO - Polytope user key found in session cache for user cgr
2024-12-18 09:10:21 - INFO - Checking request status (./49adba5d-a694-4045-89da-19b07902acd8)...
2024-12-18 09:10:21 - INFO - The current status of the request is 'queued'
2024-12-18 09:10:22 - INFO - The current status of the request is 'processing'
2024-12-18 09:10:24 - INFO - The current status of the request is 'processed'
[1]:
<xarray.Dataset> Size: 53kB
Dimensions:    (datetimes: 1, number: 1, steps: 1, points: 1093)
Coordinates:
  * datetimes  (datetimes) <U20 80B '2024-12-17T12:00:00Z'
  * number     (number) int64 8B 1
  * steps      (steps) int64 8B 0
  * points     (points) int64 9kB 0 1 2 3 4 5 ... 1087 1088 1089 1090 1091 1092
    x          (points) float64 9kB 37.08 37.08 37.08 37.15 ... 42.0 42.0 42.07
    y          (points) float64 9kB 351.1 351.2 351.3 ... 351.6 351.7 351.7
    z          (points) float64 9kB 0.0 0.0 0.0 0.0 0.0 ... 0.0 0.0 0.0 0.0 0.0
Data variables:
    2t         (datetimes, number, steps, points) float64 9kB 290.9 ... 289.0
    ssrd       (datetimes, number, steps, points) float64 9kB 0.0 0.0 ... 0.0
Attributes:
    class:          od
    Forecast date:  2024-12-17T12:00:00Z
    domain:         g
    expver:         0001
    levtype:        sfc
    number:         1
    step:           0
    stream:         enfo
    type:           pf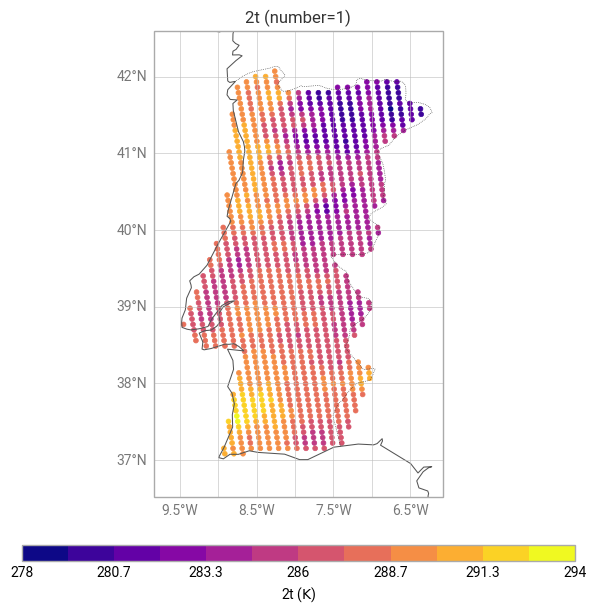
date: 2024-12-17T12:00:00ZThe Xarray dataset can be plotted as a point cloud.
[2]:
import earthkit.plots as ekp

chart = ekp.Map(domain="Portugal")
chart.point_cloud(da['2t'], x="y", y="x")

chart.coastlines()
chart.borders()
chart.gridlines()

chart.title("{variable_name} (number={number})")

chart.legend()

chart.show()